

Understand every step your visitors take
Count visits and read movement inside the store

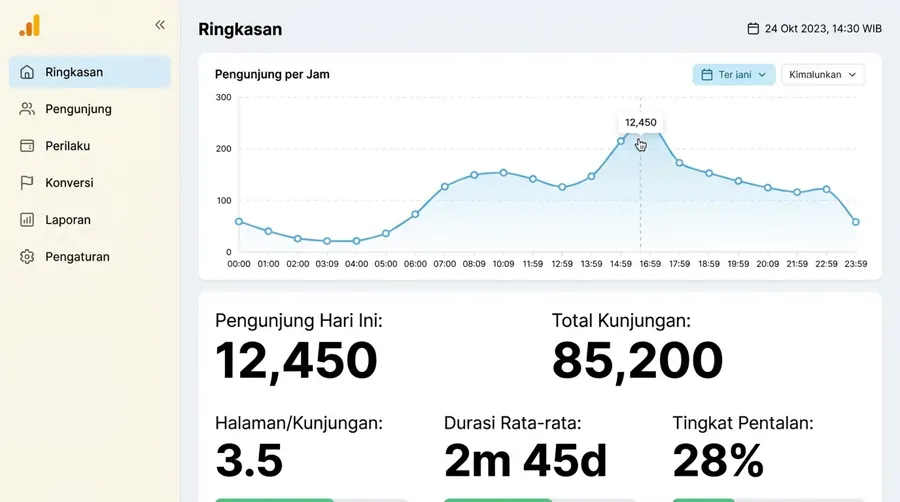
See what actually draws attention
The most-walked routes and the areas people linger in are read from the cameras already in the store. Nothing new goes on the ceiling, and identities are blurred on site before any data moves anywhere.
Insight within reach
The metrics the node actually produces — not a wish list.
Visit counting
How many visitors come in and go out, hour by hour.
Movement patterns in store
The most-walked routes and the areas people linger in longest.
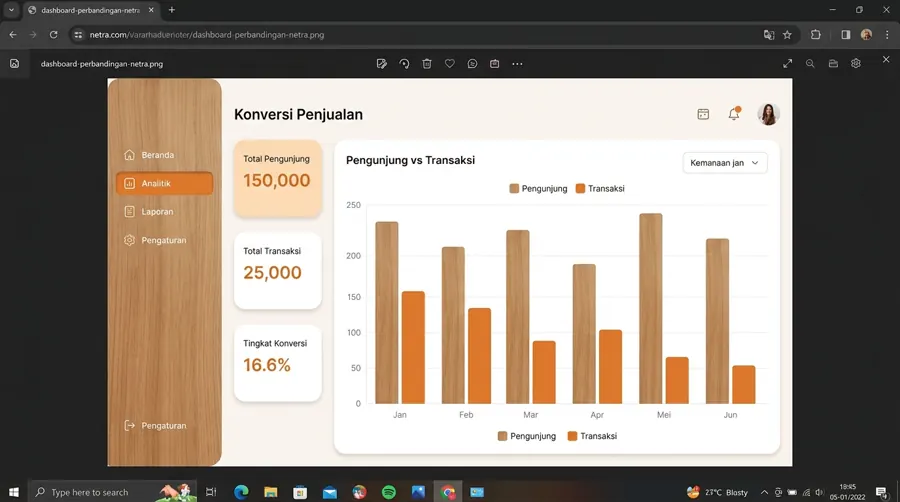
Anonymous on the device
Identities are blurred on site before any data moves anywhere.
For shops like these
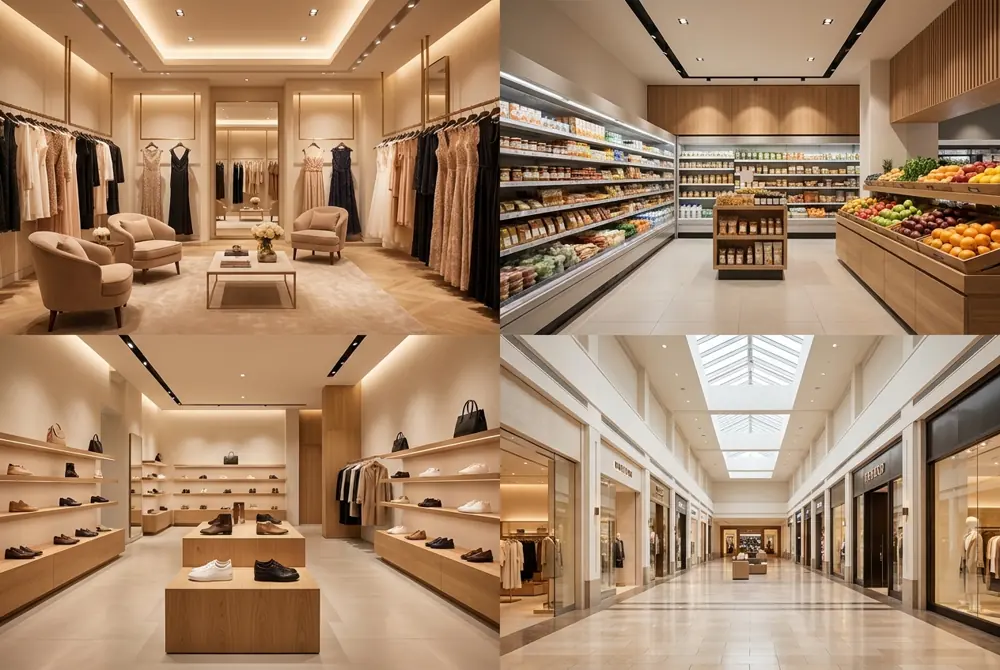
Retail & convenience stores
Shopping centres
Restaurants & cafés
Pharmacies & clinics
How it works
- 01
Your existing cameras are reused
The cameras already installed inside the store are connected to a Netra Node. Nothing new goes up in the ceiling.
- 02
The node reads visits
The node counts visitors entering and leaving, then maps the paths most often walked through the space. Faces are never stored.
- 03
Patterns read by the hour
Counts are sent as hourly summaries, so busy hours and the most-occupied areas can be compared day to day.